


Table of Contents
1. Introduction
WafCharm recently updated the Analytics section on the Dashboard, expanding its analytic capabilities. In this blog post, we'll take a look at the WAF log dashboard feature.
2. What Is the WAF Log Dashboard?
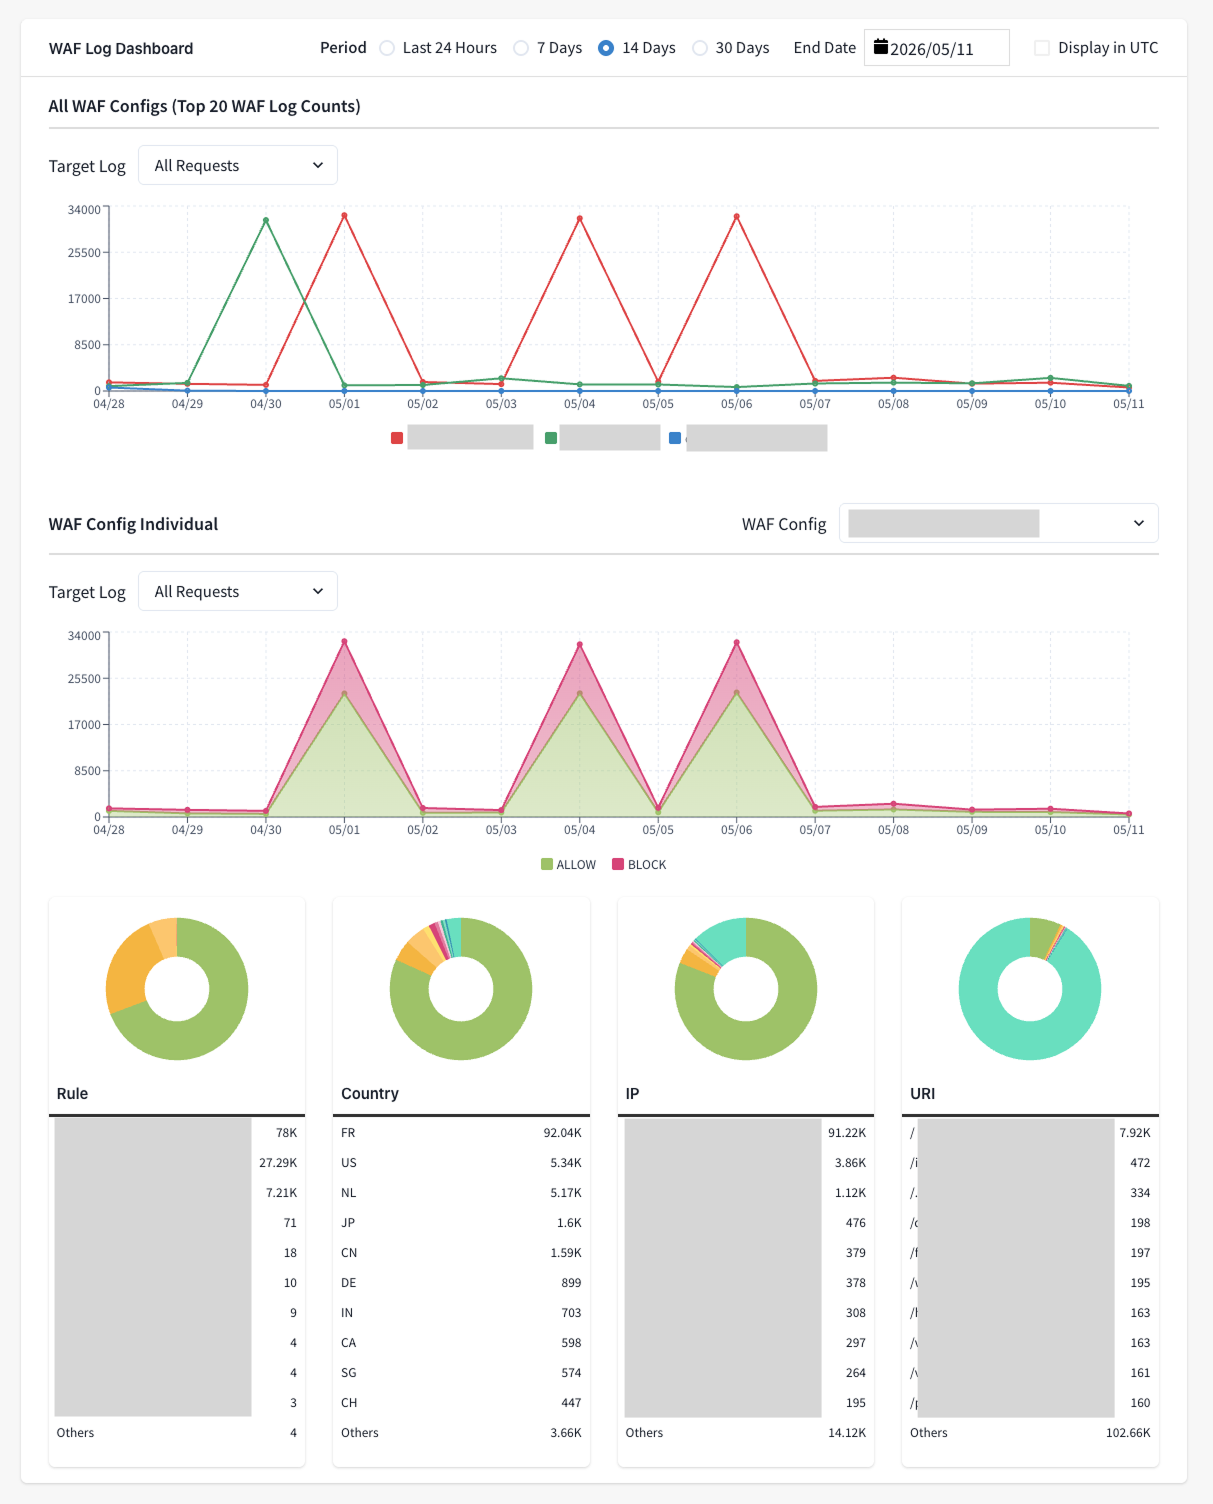
The WAF log dashboard is a feature that gives you a cross-sectional view of request activity across all WAF configs registered in WafCharm. You can check information such as the number of allowed or blocked requests, either across all registered WAF configs or on a per-WAF config basis.
When there are significant fluctuations in request counts, this feature helps you find something unusual, and lets you review the status of both blocked and allowed requests.
The upper section displays a graph covering all registered WAF configs,* while the lower section shows a per-WAF config graph for the selected WAF config, along with ranking-based information on the detection rules, request source countries, IP addresses, and request destination URIs for the aggregated requests.
*If there are 21 or more registered WAF configs, only the top 20 by the total number of WAF logs linked to WafCharm are displayed.
For more details, see also About the dashboard page.
3. How to Get Started
To use the WAF log dashboard, you need to configure WAF log integration (new method). Please refer to the help pages below for detailed instructions.
- How to configure WAF log integration (new method) for AWS WAF v2 Advanced
- How to configure access logs/WAF log integration for AWS WAF v2 Legacy
Please note that even when WAF log integration is configured with the new method, the data availability varies depending on your plan and usage.
- For the old plan:
- Only the 24-hour view is supported
- For the new plan:
- WAF log storage format set to fixed mode: only the 24-hour view is supported
- WAF log storage format set to expanded mode: all display periods are supported (the WAF logs available for display depend on the number of days specified for the WAF log retention period)
For details on the WAF log storage format, see About WAF Log Retention Period.
4. Use Cases
Checking request activity
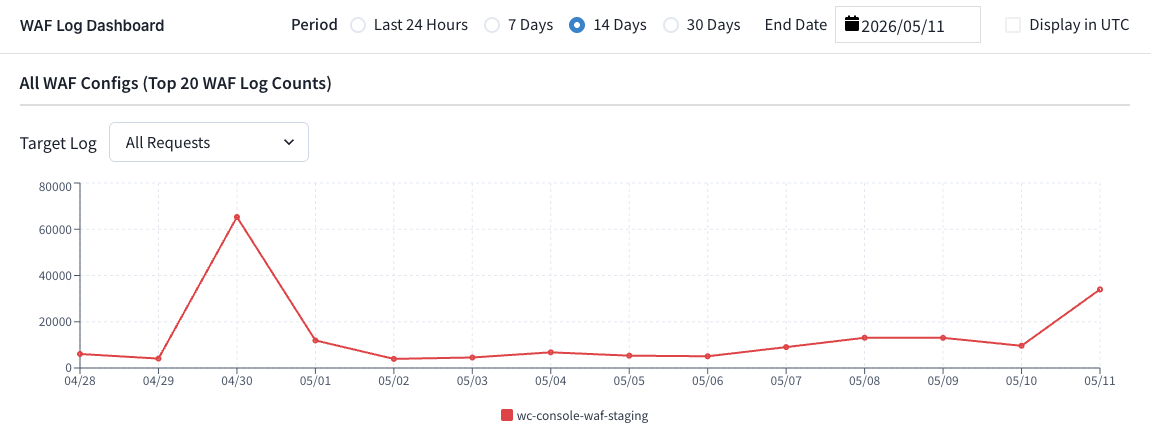
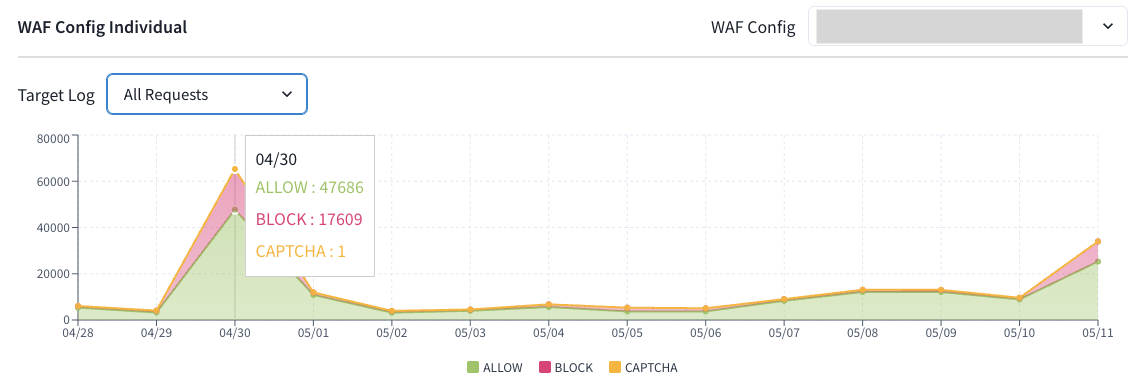
The upper section of the WAF log dashboard displays a graph covering all WAF configs. Setting the log target to "All Requests" under "Target Log" lets you view trends in request activity. In this example, request counts appear to spike at certain points in time.
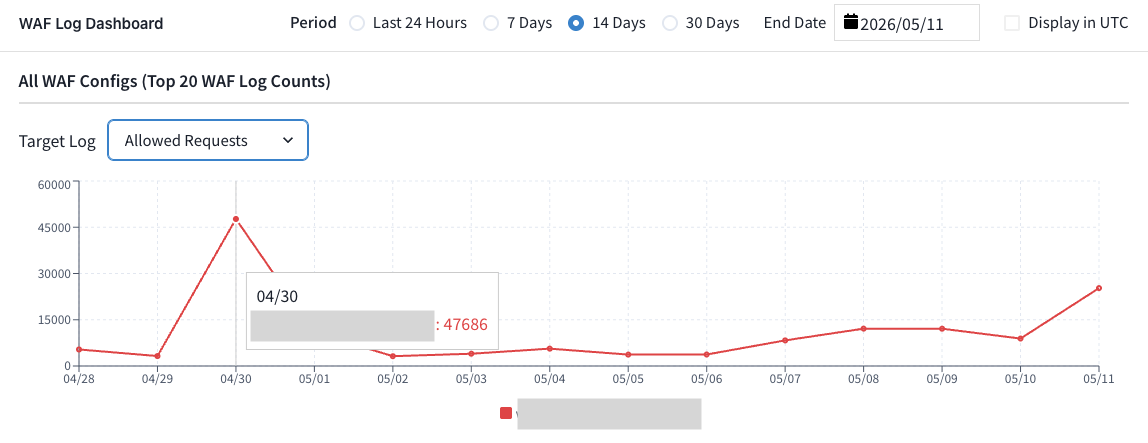
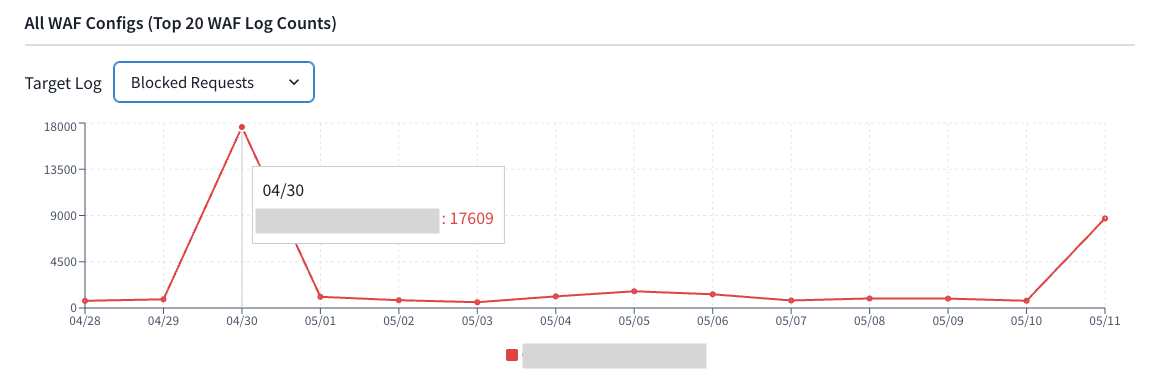
The "Target Log" can be filtered to show either blocked requests or allowed requests. In this example, allowed requests appear to outnumber blocked requests. If you anticipated an event at this moment, the spike may have coincided with a period when the increase was expected. If no such event was anticipated, it may be worth investigating the possibility of an increase in bot traffic etc.
Investigating request trends per WAF config
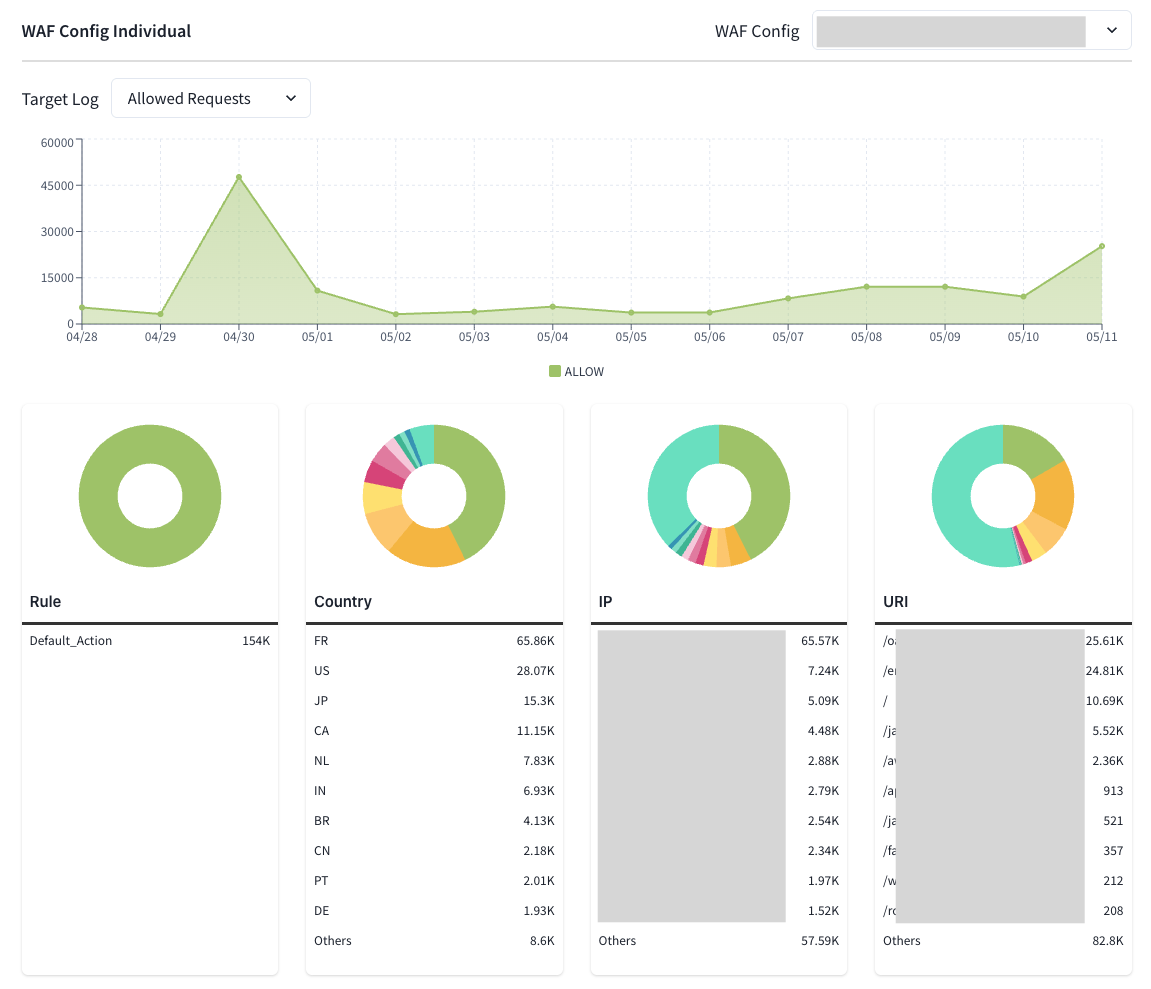
Below the graph covering all WAF configs, there is a graph for individual WAF configs. Here you can also view request counts broken down by action.
The pie chart displayed below, the line graph changes based on the log target you have specified. In this example, since allowed requests outnumber blocked ones during the target period, we will take a closer look at those.
The only rule shown is Default_Action. This is the value recorded in the WAF logs when the request does not match any rule in the web ACL and is ultimately allowed. This tells us that no requests matched individual allow rules in allowlist. When no explicit allow rules exist, all allowed requests may be recorded as Default_Action.
By country, FR (France) ranks first, followed by US (United States). If a certain number of traffic from France is not expected, it could be a sign of a potential attack or increased bot activity.
One IP address stands out at the top. Since the count is close to that of the country ranking, there may be a correlation between the two. It may be worth conducting a search by IP address. In this case, the top IP address was from France. If these requests are unexpected, simply adding this IP address to a denylist may be enough to block the majority of them.
Looking into URIs, you can check whether the unexpected requests to URIs increased, or requests to URIs that do not exist. If you see such cases, you can use the WAF log search feature to query WAF logs by URI and dig deeper into the details of those requests. If you see anything in common other than country or IP address, you may be able to use those values as the basis for creating a blocking rule.
For more details on the WAF log search feature, see also About the WAF log search feature.
5. Conclusion
In this post, we looked at the updated WAF log dashboard. We hope this helps you get a clearer picture of your overall request activity.