*The original blog post was written in the past. Amazon Elasticsearch is now Amazon Opensearch.
Table of Contents
- 1. Introduction
- 2. What is Amazon Elasticsearch Service?
- 3. What is Kinesis Data Firehose?
- 4. Preparing Amazon Elasticsearch Service
- 5. Setting Kinesis Data Firehose
- 6. Setting AWS WAF
- 7. Setting Kibana
- 8. Setting Kibana Dashboard
- 9. Conclusion
1. Introduction
We are going to take a look at one of the AWS WAF feature “real-time visibility” using AWS’s official blog below.
The main services we will be using are Amazon Elasticsearch Service and Kinesis Data Firehose.
*There are two versions of AWS WAF. We are using a log from AWS WAF Classic for this post.
2. What is Amazon Elasticsearch Service?
Amazon Elasticsearch Service is a fully managed service that deploys, protects, and operates Elasticsearch with ease and at scale without downtime. This service not only provides open-source Elasticsearch API and managed Kibana, but it also imports data from any sources through the integration of Logstash and other AWS services, allowing real-time search, analysis, and visualization.
Official Information
https://aws.amazon.com/elasticsearch-service/
https://aws.amazon.com/elasticsearch-service/features/
3. What is Kinesis Data Firehose?
WafCharm users may have set up the service, but WafCharm uses Kinesis Data Firehose for reporting/notification features.
The official information are provided below.
https://aws.amazon.com/kinesis/data-firehose/
https://aws.amazon.com/kinesis/data-firehose/features/
The feature of this service is to load streaming data to a data store or analysis tools almost in real-time.
Data can be loaded to Amazon S3, Amazon Redshift, Amazon Elasticsearch Service, Kinesis Data Analytics, and Splunk.
4. Preparing Amazon Elasticsearch Service
Firstly, prepare an environment for Amazon Elasticsearch Service.
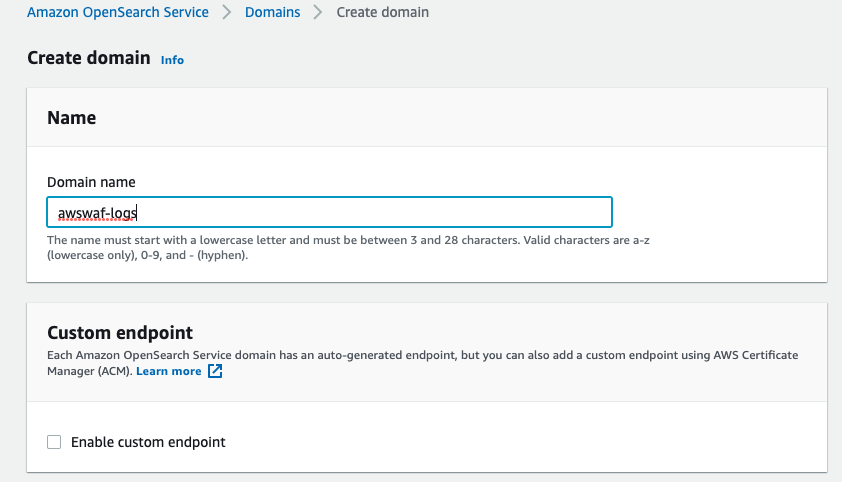
4-1. Create a new domain and enter “awswaf-logs” into the Domain name.
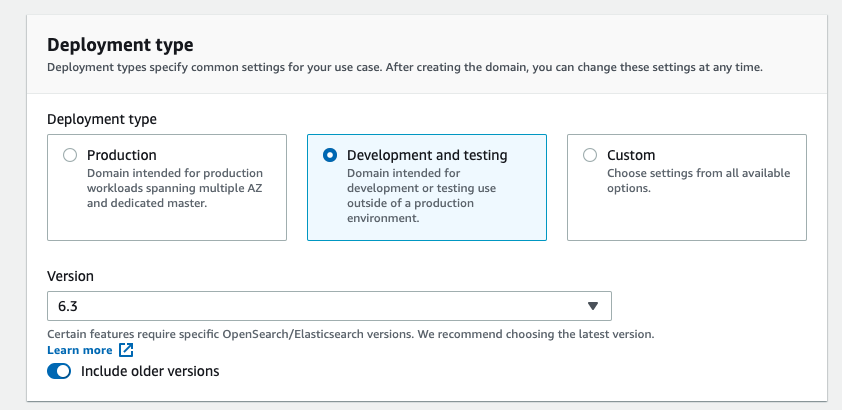
We are setting this up at minimal configuration for testing purposes. For the Deployment type, select “Development and testing”.
Set the version to 6.3, as shown in the official blog.
*With version 7.1, we couldn’t use the mapping setting explained below by following the steps in the official blog.
*Make sure to turn on the “Include older versions” option to select version 6.3.
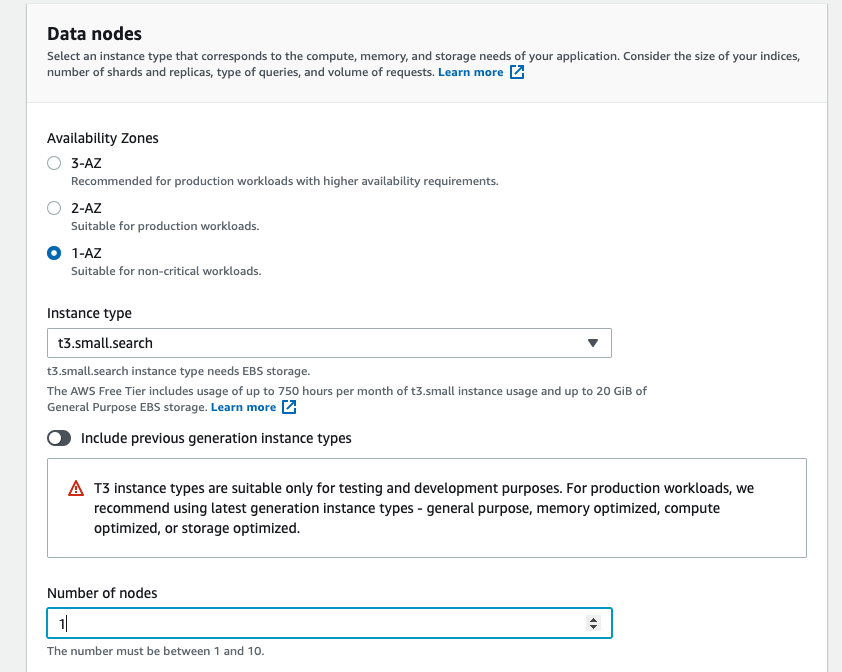
4-2. Select “1-AZ” for Availability Zones.
4-3. Select “t3.small.search” for instance type because we are setting this up for testing purposes.
4-4. Enter “1” for Number of nodes. The rest can be left as default.
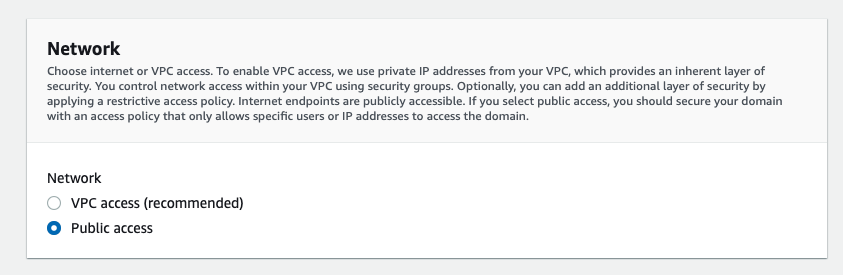
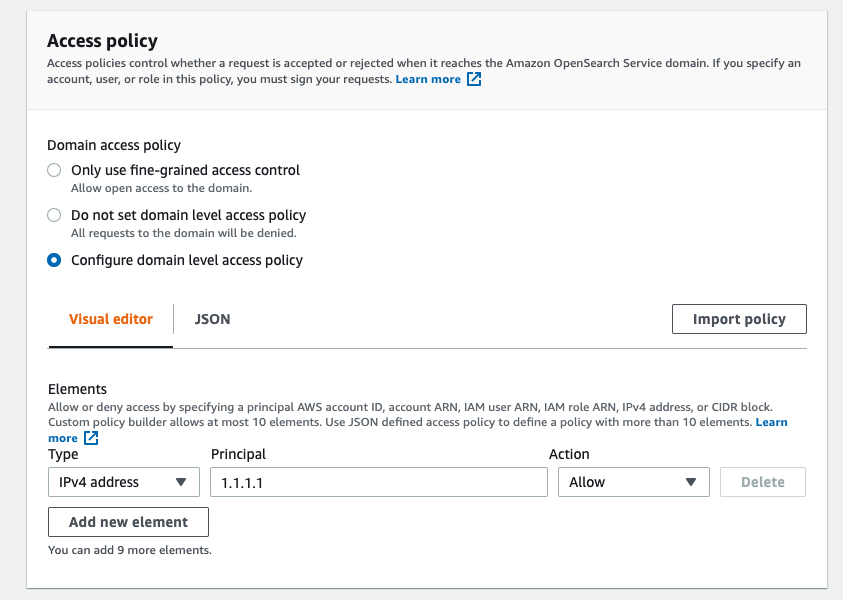
4-5. Select “Public access” for Network and limit the access by IP addresses in the Access policy section.
Select “Configure domain level access policy” for Domain access policy and enter an IP address in the Elements shown below the Visual editor.
In the screenshot below, we have selected “IPv4 address” for the type, entered “1.1.1.1” for Principle, and set Action to “Allow”.
4-6. Keep the rest of the options to default.
4-7. If you see a confirmation page, review the setting and continue.
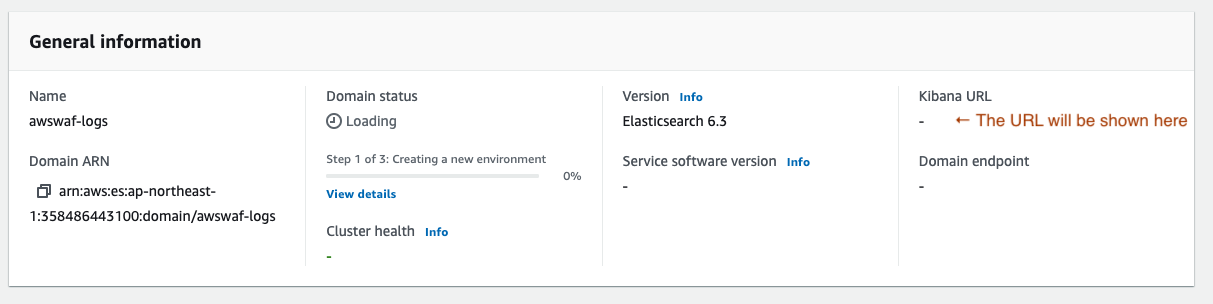
4-8. When the environment has been set up, the access point for Kibana will be presented.
See the URL shown below “Kibana URL”.
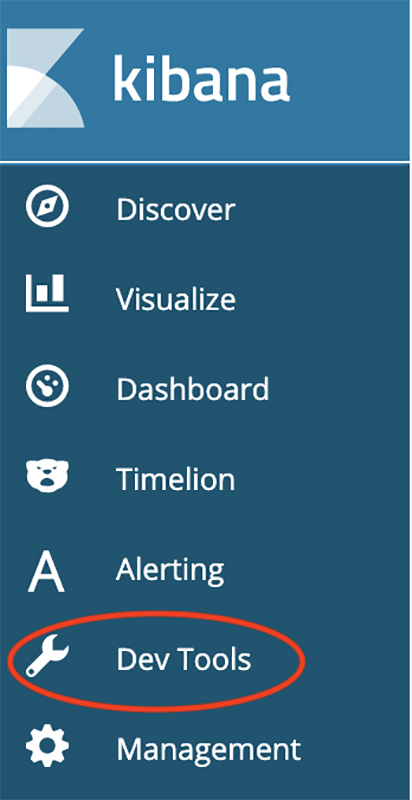
4-9. Once you access Kibana, select “Dev Tools” in the menu on the left.
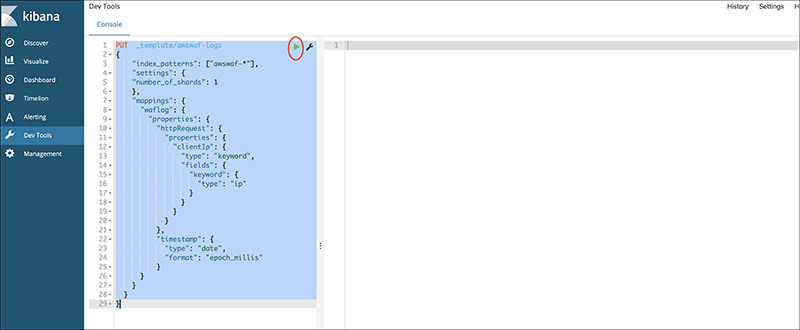
4-10. Copy and paste the pattern template from the official blog and click the Run button on the top right corner.
*This is a process to declare the index beforehand. To be more precise, this template declares that httpRequest.clientIP field is using an IP address and converts the timestamp from the default UNIX time.
*Index will be automatically generated if you import the logs first, so make sure to apply this template before you import any log.
5. Setting Kinesis Data Firehose
Because the Delivery stream name has naming rules when used for AWS WAF, make sure it starts with “aws-waf-logs”. For this procedure, we will use “aws-waf-logs-kibana”. The rest of the settings can stay as default.
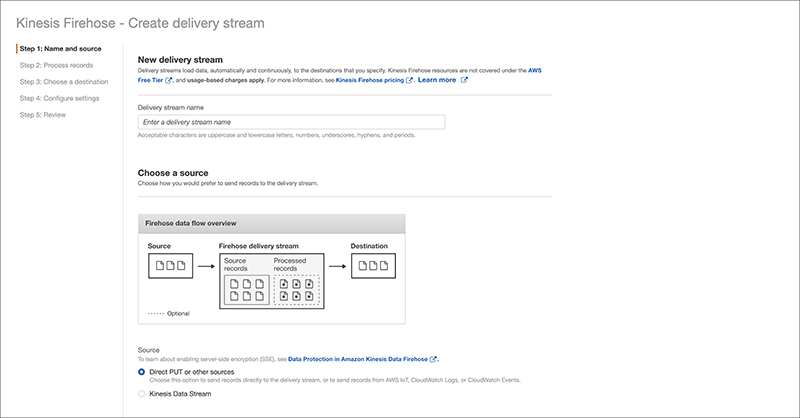
The next settings can be set to default as well.
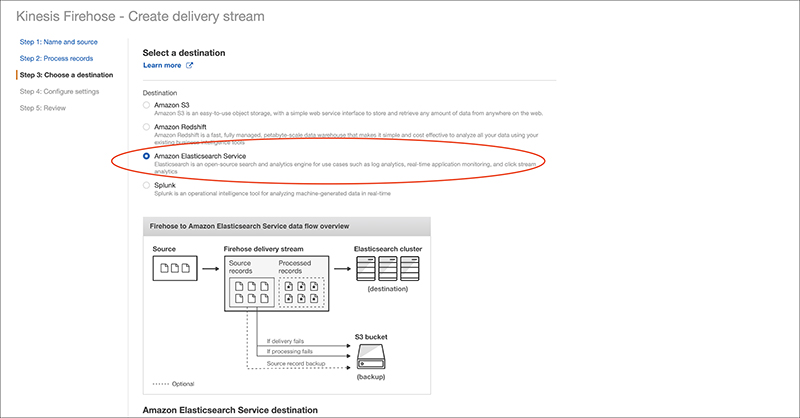
Select “Amazon Elasticsearch Service” for the Destination.
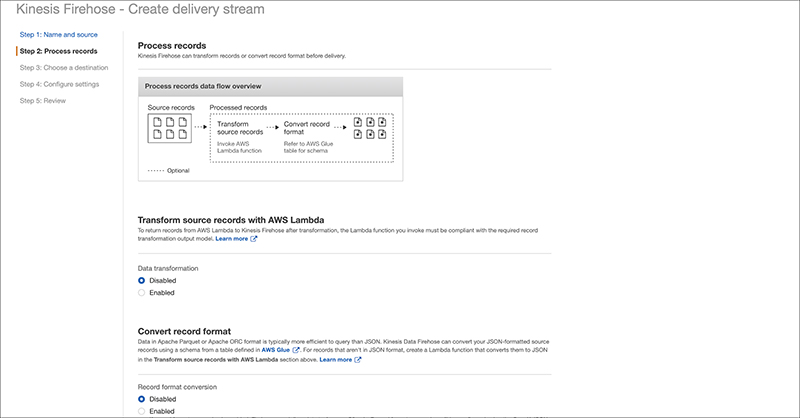
We will follow the official blog for the input field.
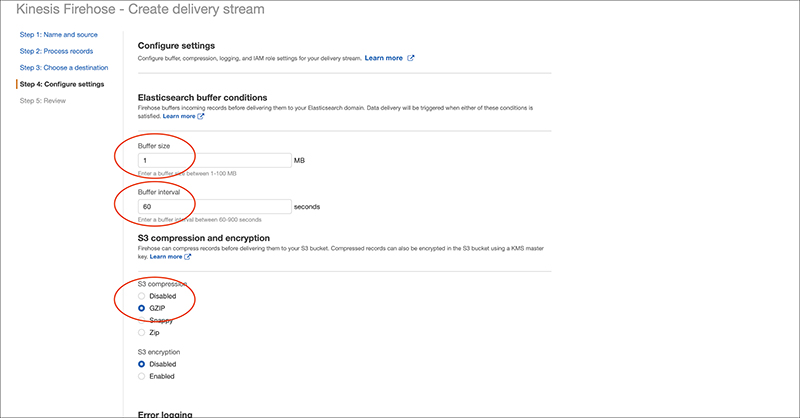
For the S3 backup setting, choose settings suitable for your testing environment.
In the next section, you can set Buffer size and Buffer interval.
Since this is a testing environment, we are changing them to the minimum value of 1MB / 60 seconds.
To lessen the usage of S3, select GZIP for S3 compression.
*Buffer size / Buffer interval indicates how often the logs will be delivered.
Refer to the official blog below for IAM settings.
https://docs.aws.amazon.com/firehose/latest/dev/controlling-access.html
Finally, you will see the confirmation page and complete the setting process.
6. Setting AWS WAF
Select the Kinesis Data Firehose we just set up as a place to deliver logs in AWS WAF’s setting page.
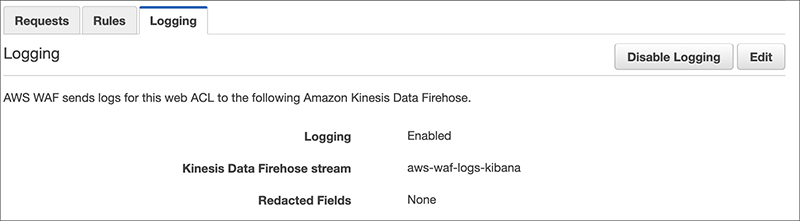
Once this setting is complete, logs will be delivered, so we will return to Kibana for the rest of the setup.
7. Setting Kibana
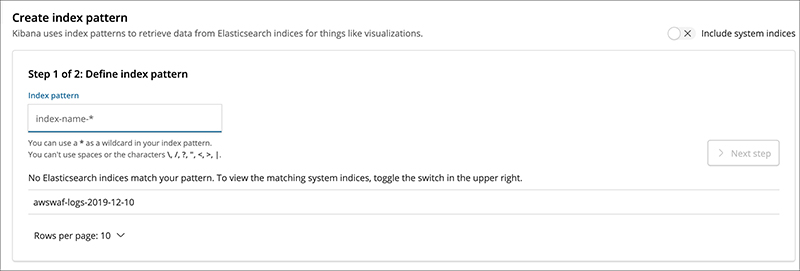
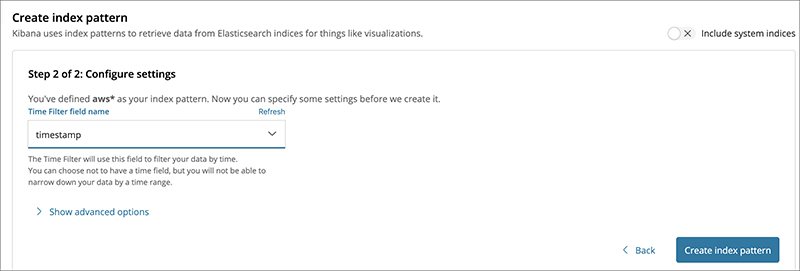
When you log in to Kibana, a new index “awswaf-” will appear.
You need to define an index pattern that encompasses all awswaf log entries, so enter “awswaf-*” in the Index pattern and select timestamp filter on the next screen.
You have completed the setting to load the logs.
8. Setting Kibana Dashboard
Here, we will import the template from the official blog.
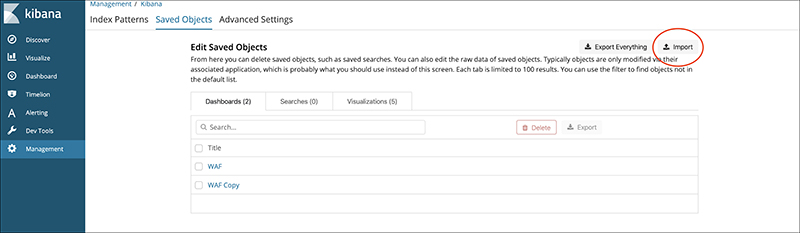
Open “Saved Objects” from the Management menu.
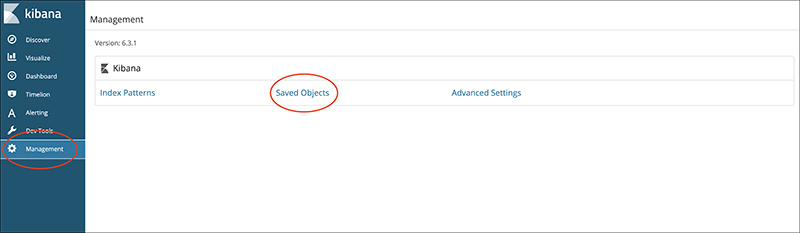
Save and import the files “sample dashboard” and “sample visualizations” available in the official blog using the import button.
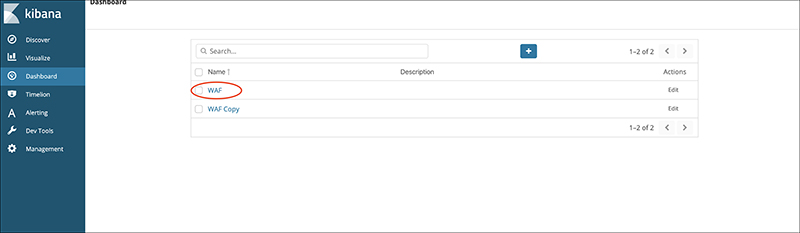
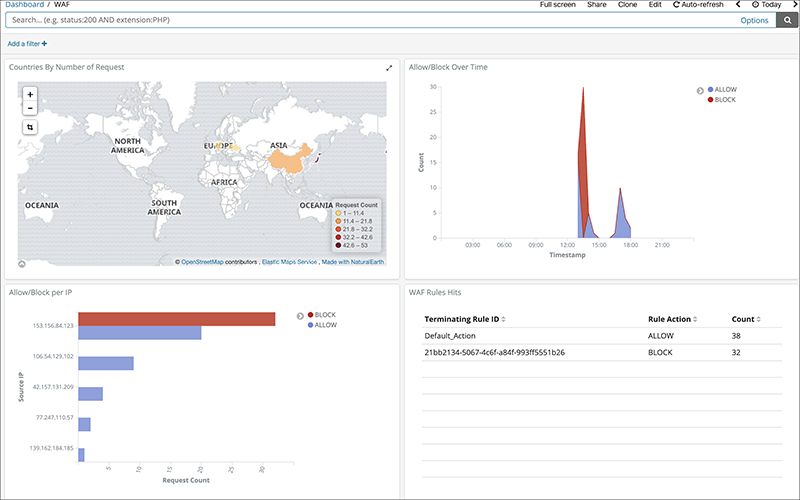
Select the imported templates from the Dashboard menu to see each dashboard.
The screenshot below shows the result of changing the view to a pie chart.
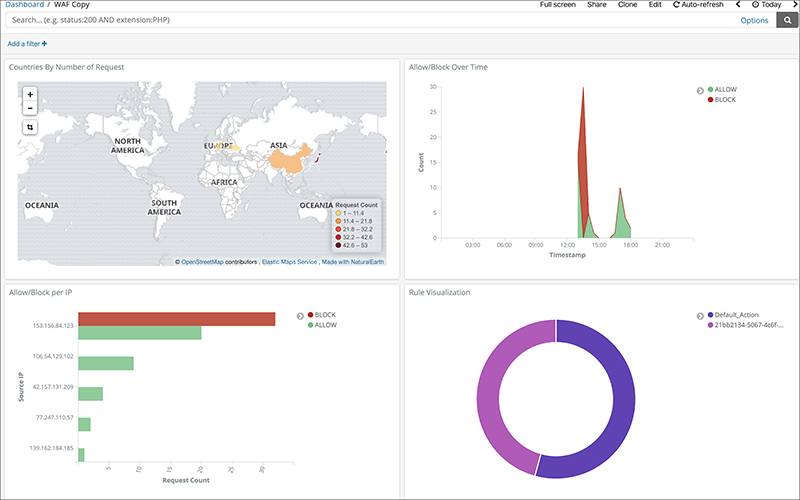
A lot of information on creating a graph is publicly available, so it was fairly easy to create the chart with a bit of research.
A heat map can also be created, so you could possibly visualize a period of time that receives a lot of attacks.
9. Conclusion
Since many of the features are used together, setting up an environment could be a bit difficult. However, once you are done with setting Elasticsearch Service and Kinesis Data Firehose, all you need to do is to visualize the data using Kibana and analyze it in various ways.
Data are delivered almost in real-time, so if that’s something important in your operation, implementing this feature is recommended.
*We have mentioned above, but if you are setting the Elasticsearch Service just like the official blog has done, the key point is mapping before importing the Elasticsearch Service version and logs.
If you already use Elasticsearch Service, setting up procedures may seem straightforward.